More and more students are staring at paintings as part of medical school curriculum. For instance, Stanford students observe art alongside their faculty at the Cantor Arts Center as part of the Medicine & the Muse Program to improve their observational and descriptive abilities — skills that are essential to health care providers.
Some doctors are taking it a step further. Fascinated by how health problems have affected famous artists, they are combing historical records and works of art for diagnostic clues, as a recent article in Artsy explains. And then they are publishing their studies in peer-reviewed medical journals.
According to a study published in JAMA Ophthalmology, for example, Leonardo da Vinci had crossed eyes — a vision disorder called strabismus — that caused him to lose depth perception. Researcher Christopher Tyler, PhD, DSc, from the City University of London, hypothesized this by assessing two sculptures, two oil paintings and two drawings by da Vinci that are thought to portray him. Measuring the average angular divergence of the pupils in these works, he found the mean angle of misalignment to be consistent with strabismus.
Another case study published in the British Journal of General Practice suggests that impressionist painter Claude Monet’s color selection was affected by poor eyesight, since his color palette changed after cataract surgery. “Monet’s postoperative works are devoid of garish colors or course application,” said National Health Service ophthalmologist and author Anna Gruener, MD, in the Artsy article. “It is therefore unlikely that he had intentionally adopted the broader and more abstract style…”
However, Michael Marmor, MD, a Stanford ophthalmology professor and author of several books on artists and eyesight, warns doctors against making firm conclusions.
“Artists have license to paint as they wish, so style is mutable and not necessarily an indication of disease,” Marmor told Artsy. “Speculation is always fun, but not when it is presented as ‘evidence’ in scientific journals.”
This is a reposting of my Scope blog story, courtesy of Stanford School of Medicine.
It may seem obvious that the trauma of genocide, mass killings, rape and torture will cause mental health issues in the victims. But courts require evidence. So the Human Rights in Trauma Mental Health Program at Stanford provides the evidence needed in such judicial processes.
The program is an interdisciplinary collaboration between the WSD Handa Center for Human Rights and International Justice, Stanford Law School and Stanford University School of Medicine. I recently spoke with Daryn Reicherter, MD, a Stanford psychiatrist and the director of the program.
How did you become a human rights advocate?
“I was clinically treating survivors of human rights violations at refugee clinics and the center for survivors of torture. So I became familiar with treating issues like depression and post-traumatic stress disorder. And the very obvious cause of the mental health issues I was seeing was political trauma and torture — basically human rights violations.
Another major catalyst was working with the bigger network that supports these patients, particularly human rights attorneys. I’ve remained involved with the clinical part, the rehabilitation of victims of human rights violations. As doctors, my colleagues and I are starting with patients who already have terrible outcomes because of what happened to them. The attorneys are starting with how to get people access to mental health resources, or how to stop a crime from ever happening or how to hold a human rights violator accountable in a court. I started recognizing that the person in front of me has a larger problem that affects more people. So I started collaborating on how to use the science of psychology to make changes in human rights.“
What kinds of traumas does the program handle?
“Our program has worked on a whole bunch of different projects, spanning from mass rapes in the Central African Republic to torture in Somalia. We’ve even worked on preventing California from putting men in solitary confinement for longer than 10 years.”
What is your role?
“We consult with attorneys who are trying to use the science of mental health to demonstrate a point about human rights violations. Our final product is usually a written report about an individual or situation, which is used by the attorneys in court. And we’re often asked to testify to clarify things in the report.
For instance, we write expert reports demonstrating that individuals have post-traumatic stress disorder from torture, which is likely to help them win asylum in immigration courts around the world. And if there are many asylum claims that outline human rights violations happening in a country, we put together a report that is delivered to programs concerned with human rights violations and that ultimately may help create sanctions against the country that’s committing the violations.”
What is it like to work in international courts?
“I’ve testified at the International Criminal Court on two occasions. In U.S. courts, lawyers argue in front of judges. In international courts, it’s really a dialogue between attorneys, judges and experts. And that’s very exciting.
Being an expert witness for something that’s so clear cut is actually quite simple. For instance, I testified in an egregious child rape case in the Fiji High Court. I presented evidence showing the man that raped his daughter over 300 times caused a lot of damage to her psychology, including the likelihood of her suffering from PTSD, depression, regular nightmares and other mental issues. The man got a life sentence, which had never happened before. And the attorney also used our report and my testimony in the Fiji Supreme Court, which extended the possible sentence for child rape. That’s exactly how our program hopes to work with attorneys and courts, in the U.S. and internationally.”
How do you personally cope with this work?
“I’m passionate about doing clinical treatment, but I actually find it to be more emotionally challenging than my advocacy work. It’s more difficult to work with somebody who’s been through this kind of human rights violations than to write a detailed report, go into a court of law and present the facts.
And in court, I sometimes see justice. I see reparations given for mental health. I see someone winning asylum because they really ought to, and now they have access to mental health treatments. So for me the program is the morale booster.
Of course, I still need self-care. I can recall five or 10 stories that in an instant can bring tears to my eyes. And I’ve heard some stories I wish I could un-hear, but that’s the reality. If I’m able to translate that pain and grief into something that’s advantageous for that person or situation, wow, that’s power. And overall, I find our program to be very light, not dark.”
What are your future goals?
“We don’t want to be limited to cases with data published in psychiatry journals, but our program doesn’t have the manpower to collect all the data needed for court cases. So we’re developing validated screening tools from the Diagnostics and Statistical Manual of Mental Disorders that shouldn’t require an expert for data collection.
For example, if our attorney colleagues can ask a five-point questionnaire to see if someone has the hallmark symptoms of PTSD, then we can interpret the data. I think that’s the next big thing for our program, in addition to continuing and expanding our cases.”
This is a reposting of my Scope blog story, courtesy of Stanford School of Medicine.
Poor people are more likely to have health problems starting at birth and to die younger than rich people. This stark inequality is firmly established, but the underlying causes and their relative contributions are not well understood.
A new Stanford study investigated whether unequal access to informal health expertise contributes to this problem. Specifically, they explored whether having a physician or nurse in your family improves your health.
The multidisciplinary team analyzed public records for Swedish residents, including socioeconomic, health care, educational and birth records. Despite Sweden’s universal health insurance system and generous social safety net, they found that health inequality still emerged early in life and persisted throughout adulthood — at levels comparable with the United States.
“This health inequity appears to be extremely stubborn,” said Petra Persson, PhD, an assistant professor of economics, in a Stanford news article. “We can throw a universal health insurance system at it and yet substantial inequality persists. So, is there anything else that can help us close that health gap between rich and poor?”
Diving deeper, the researchers divided the Swedish individuals into two groups — those with or without medical professionals in their immediate or extended families.
The team discovered that having medical expertise available from a family member led to far-reaching health improvements at all ages. Those individuals lived longer, were significantly healthier, were more likely to engage in preventive health behaviors and were more likely to adhere to medications. For example, the older relatives of medical professionals were 27 percent more likely to adhere to medications to prevent heart attacks and the younger relatives were 20 percent more likely to be vaccinated against human papillomavirus, their paper reported.
These effects occurred across all incomes, but they were even more pronounced for low-income families. This implies, according to the researchers, that the scarcity of access to medical expertise in low-income households could create and sustain inequality in health outcomes.
However, this may point to new ways to tackle the health disparity. The authors concluded in the paper, “Our analysis suggests that access to expertise improves health not through preferential treatment, but rather through intra-family transmission of ‘low-tech’ (and hence, cheap) determinants of health, likely ranging from the sharing of nuanced knowledge about healthy behaviors, to reminders about adherence to chronic medication, to frequent and trustful communication about existing health.”
Persson added in the piece, “If the government and health care system, including public and private insurers, could mimic what goes on inside families, then we could reduce health inequity by as much as 18 percent.”
A key solution may be in creating a closer, longer-term relationship between patients and their doctors, the authors said. But they also warned that the U.S. appears to be moving away from this “old-fashioned” primary care model when their results suggest that we want to do the reverse.
This is a reposting of my Scope blog story, courtesy of Stanford School of Medicine.
Many people make New Year’s resolutions to exercise more or eat healthier. Not Stanford neurobiology professor Andrew Huberman, PhD. This year he set out to educate the public about exciting discoveries in neuroscience using Instagram.
Huberman’s sights are high: he pledged to post on Instagram one-minute educational videos about neuroscience an average of five times per week for an entire year. I recently spoke with him to see how he’s doing on his resolution.
Why did you start the Instagram video series?
“Although I’m running a lab where we’re focused on making discoveries, I’ve also been communicating science to the general public for a while. I’ve found that there’s just immense interest in the brain — about diseases, what’s going on in neuroscience now, and how these discoveries might impact the audience. The brain is just so amazing, so the interest makes sense to me.
I don’t spend much time on social media, but Instagram seemed like an interesting venue for science communication because it’s mostly visual. My lab already had an Instagram account that we successfully used to recruit human subjects for our studies. So at the end of last year, I was talking with a friend about public service. I told him I was thinking about creating short, daily educational videos about neuroscience — a free, open resource that anyone can view and learn from. He and some other friends said they’d totally watch that. So I committed to it in a video post to 5000 people, and then there was no backing down.”
What topics do you cover?
“I cover a lot of topics. But I feel there are two neuroscience topics that will potentially impact the general public in many positive ways if they can understand the underlying biology: neuroplasticity — the brain’s ability to change— and stress regulation. My primary interest is in vision science, so I like to highlight how the visual system interacts with other systems.
I discuss the literature, dispel myths, touch on some of the interesting mysteries and describe some of the emerging tools and technologies. I talk a bit about my work but mostly about work from other labs. And I’m always careful not to promote any specific tools or practices.”
How popular are your videos?
“We have grown to about 8,000 followers in the last six weeks and it’s getting more viewers worldwide. According to the stats from Instagram, about a third of my regular listeners are in Spanish-speaking countries. Some of these Spanish-speaking followers started requesting that I make the videos in Spanish so they could share them. Last week I started posting the videos in both English and Spanish and there’s been a great response. My Spanish is weak but it’s getting better, so I’m also out to prove neural plasticity is possible in adulthood. By the end of the year I plan to be fluent in Spanish.
I’ve also had requests to do it in French, German, Chinese and Dutch but I’m not planning to expand to additional languages yet. I think my pronunciation of those languages would be so bad that it would be painful for everybody.
Currently, my most popular video series is about the effects of light on wakefulness and sleep — such as how exposure to blue light from looking at your phone in the middle of the night might trigger a depression-like circuit. But my most popular videos include Julian, a high school kid that I mentor. People have started commenting #teamjulianscience, which is pretty amusing.”
What have you learned?
“It’s turned out to be a lot harder to explain things in 60 seconds than I initially thought. I have to really distill down ideas to their core elements. Many professors are notorious for going on and on about what they do, saying it in language that nobody can understand. My goal is to not be THAT professor.
I’ve also learned that I don’t blink. Sixty seconds goes by fast so I just dive in and rattle it off. After a couple of weeks, people started posting “you never blink!” — so now I insert blinks to get them to stop saying that.
I’ve also found the viewer comments and questions to be really interesting. They cue to me what the general public is confused about. But I’ve also found that many people have a really nuanced and deep curiosity about brain science. It’s been a real pleasure to see that.”
This is a reposting of my Scope blog story, courtesy of Stanford School of Medicine.
New Web-based Tool Hosted at NERSC Helps Visualize Exometabolomic Data
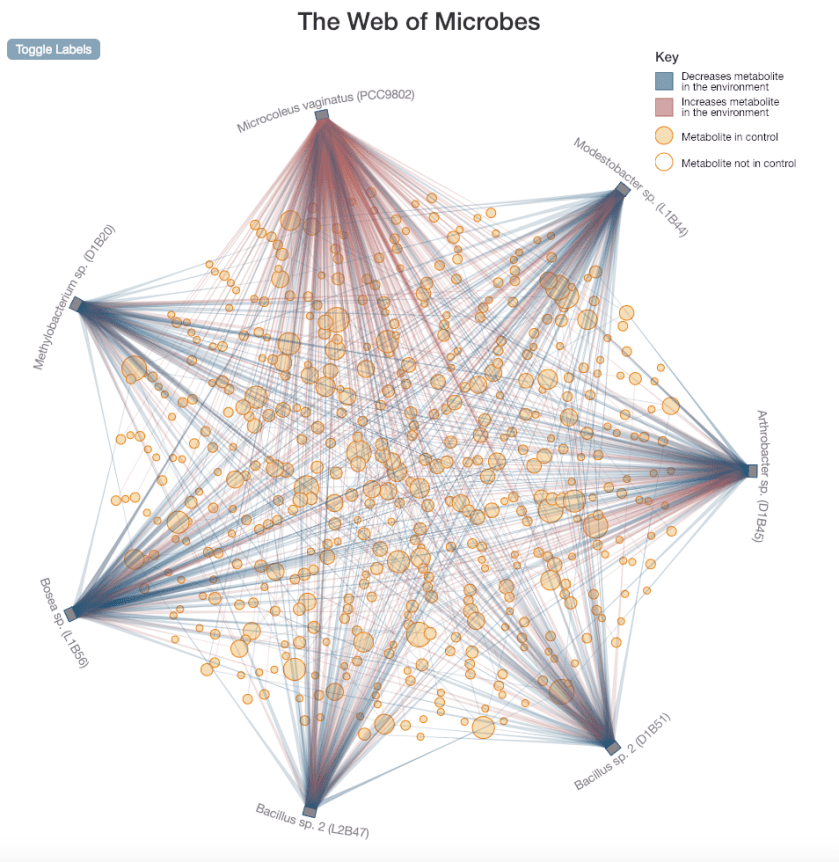
WoM The Web: Microcoleus vaginatus and six heterotrophic biocrust isolates in M. vaginatus extract. The metabolite composition of the control medium is represented by the solid tan circles. Hollow circles are metabolites that were only identified after microbial transformation (indicating production/release by at least one of the organisms and not initially present in the control medium). Connecting lines indicate an increase (red) or decrease (blue) in the metabolite level in the spent medium compared to the control.
Understanding nutrient flows within microbial communities is important to a wide range of fields, including medicine, bioremediation, carbon sequestration, and sustainable biofuel development. Now, researchers from Lawrence Berkeley National Laboratory (Berkeley Lab) have built an interactive, web-based data visualization tool to observe how organisms transform their environments through the increase and decrease of metabolites — enabling scientists to quickly see patterns in microbial food webs.
This visualization tool — the first of its kind — is a key part of a new data repository, the Web of Microbes (WoM) that contains liquid chromatography mass spectrometry datasets from the Northen Metabolomics Lab located at the U.S. Department of Energy’s Joint Genome Institute (JGI). The Web of Microbes project is an interdisciplinary collaboration between biologists and computational researchers at Berkeley Lab and the National Energy Research Scientific Computing Center (NERSC). JGI and NERSC are both DOE Office of Science user facilities.
“While most existing databases focus on metabolic pathways or identifications, the Web of Microbes is unique in displaying information on which metabolites are consumed or released by an organism to an environment such as soil,” said Suzanne Kosina, a senior research associate in Berkeley Lab’s Environmental Genomics & Systems Biology (EGSB) Division, a member of the DOE ENIGMA Scientific Focus Area, and lead author on a paper describing WoM published in BMC Microbiology. “We call them exometabolites since they are outside of the cell. Knowing which exometabolites a microbe ‘eats’ and produces can help us determine which microbes might benefit from growing together or which might compete with each other for nutrients.”
Four Different Viewpoints
WoM is a python application built on the Django web development framework. It is served from a self-contained python environment on the NERSC global filesystem by an Apache web server. Visualizations are created with JavaScript, cascading style sheets, and the D3 JavaScript visualization library.
Four different viewing methods are available by selecting the tabs labeled “The Web”, “One Environment”, “One Organism”, and “One Metabolite.” “The Web” view graphically displays data constrained by the selection of an environment, while the other three tabs display tabular data from three constrainable dimensions: environment, organism, and metabolite.
“You can think of the 3D datasets as a data cube,” said NERSC engineer Annette Greiner, second author on the BMC Microbiology paper. “The visualization tool allows you to slice the data cube in any direction. And each of these slices gives one of the 2D views: One Environment, One Organism, or One Metabolite.”
The most intuitive way to view the data is via The Web, which displays an overview of connections between organisms and the nutrients they act on within a selected environment. After choosing the environment from a pull-down menu, The Web provides a network diagram in which each organism is represented as a little box, each metabolite as a circle, and their interactions as connecting lines. The size of the circle scales with the number of organisms that interact with that metabolite, whereas the color and shade of the connecting line indicate the amount of increase (red) or decrease (blue) in the metabolite level due to the microbial activation.
“Having a lot more connecting lines indicates there’s more going on in terms of metabolism with those compounds in the environment. You can clearly see differences in behavior between the organisms,” Greiner said. “For instance, an organism with a dense number of red lines indicates that it produces many metabolites.”
Although The Web view gives users a useful qualitative assessment of metabolite interaction patterns, the other three tabular views provide more detailed information.
The One Environment view addresses to what extent the organisms in a single environment compete or coexist with each other. The heatmap table shows which metabolites (shown in rows) are removed or added to the environment by each of the organisms (shown in columns), where the color of each table cell indicates the amount of metabolic increase or decrease. And icons identify whether pairs of organisms compete (X) or are compatible (interlocking rings) for a given metabolite.
“For example, if you’re trying to design a bioreactor and you want to know which organisms would probably work well together in the same environment, then you can look for things with interlocking rings and try to avoid the Xs,” said Greiner.
Similarly, the One Organism heatmap table allows users to compare the actions of a single microbe on many metabolites across multiple environments. And users can use the One Metabolite table to compare the actions of multiple organisms on a selected metabolite in multiple environments.
“Ultimately, WoM provides a means for improving our understanding of microbial communities,” said Trent Northen, a scientist at JGI and in Berkeley Lab’s EGSB Division. “The data and visualization tools help us predict and test microbial interactions with each other and their environment.”
Participatory Design
The WoM tools were developed iteratively using a participatory design process, where research scientists from Northen’s lab worked directly with Greiner to identify needs and quickly try out solutions. This differed from the more traditional approach in which Greiner completes a coherent design for the user interface before showing it to the scientists.
Both Greiner and Kosina agreed that collaborating together was fun and productive. “Instead of going off to a corner alone trying to come up with something, it’s useful to have a user sitting on my shoulder giving me feedback in real time,” said Greiner. “Scientists often have a strong idea about what they need to see, so it pays to have frequent interactions and to work side by side.”
In addition to contributing Greiner’s expertise in data visualization and web application development, NERSC hosts WoM and stores the data. NERSC’s computing resources and well-established science gateway infrastructure should enable WoM to grow both in volume and features in a stable and reliable environment, the development team noted in the BMC Microbiology paper.
According to Greiner, the data itself doesn’t take up much storage space but that may change. Currently, only Northen’s group can upload data but the team hopes to support multiple user groups in the future. For now, the Berkeley Lab researchers are excited to share their data on the Web of Microbes where it can be used by scientists all over the world. And they plan to add more data to the repository as they perform new experiments.
Kosina said it also made sense to work with NERSC on the Web of Microbes project because the Northen metabolomics lab relies on many other tools and resources at NERSC. “We already store all of our mass spectrometry data at NERCS and run our analysis software on their computing systems,” Kosina said.
Eventually, the team plans to link the Web of Microbes exometabolomics data to mass spectrometry and genomics databases such as JGI’s Genome Portal. They are also working with the DOE Systems Biology Knowledgebase (KBase) to allow users to take advantage of KBase’s predictive modeling capabilities, Northen added, which will enable researchers to determine the functions of unknown genes and predict microbial interactions.
This is a reposting of my news feature originally published by Berkeley Lab’s Computing Sciences.


