Wind-generated ocean waves — “wind waves” — can be major disruptors of coastal communities, marine ecosystems, offshore industries, and shipping, causing considerable environmental, geophysical, and socioeconomic impacts across the globe. Large waves during past winter storms, for example, stripped volumes of sand from Monterey, California beaches, attacked vulnerable marine terraces, and ultimately caused steep cliffs near Big Sur to crash into the sea. And around the world, these kinds of extreme weather events are becoming increasingly frequent and intense.
So it is critical to understand how global and regional wave conditions may evolve under climate change. This knowledge can then be integrated into comprehensive assessments of future coastal hazards and vulnerabilities to guide climate adaptation strategies.
Waves are generated from wind stress on the ocean surface — stronger storms generate larger waves. However, factors like storm size, intensity, translation speed, and structure combine to create different wave conditions. Modeling how atmospheric wind fields can lead to different spatial patterns of surface waves is critical for forecasts on weather time scales, but predicting how climate change alters wave conditions is much more complicated. Addressing this problem requires high performance computing.
Researchers at Lawrence Berkeley National Laboratory (Berkeley Lab) are tackling this challenge by generating and analyzing ocean wave climate projections using supercomputing resources at the National Energy Research Scientific Computing Center (NERSC), a Department of Energy user facility located at Berkeley Lab. They are also helping compile the results of international wave climate studies, creating a global ensemble dataset for widespread use by stakeholders, governments, and the research community. In the past year, two community-wide papers covering this research — including work done at Berkeley Lab — were published, one in Nature Climate Change and, more recently, in Scientific Data, also a Nature publication.
Modeling Wind-Wave Climate
Scientists use numerical general circulation models (GCMs) to simulate the dynamics and thermodynamics of the Earth’s atmosphere. Increasingly, they employ coupled GCMs to simulate the atmosphere and ocean simultaneously — and even include other components such as land hydrology — allowing feedback between the various systems. These models enable scientists to investigate the properties of the Earth’s weather and climate, both in the past and possible futures.
Only the most recent coupled atmosphere-ocean climate models include in-line wind-driven wave calculations. In addition, many climate models generate data at fairly coarse resolution, which prevents the identification of more intense storms such as tropical cyclones. The research published in Climate Change and Scientific Data compared multiple off-line wind-driven wave calculations.
Among the co-authors on these papers is Ben Timmermans, a researcher at the National Oceanography Centre in the United Kingdom and a former post-doctoral fellow in Berkeley Lab’s Climate and Ecosystems Science Division. As a postdoc, Timmermans worked with Michael Wehner, a senior scientist in Berkeley Lab’s Computational Research Division, to develop a high-resolution climate projection of average wave conditions across the globe. This work relied on simulations that Wehner had previously generated based on atmospheric data, which were collected in three-hour increments with a spatial resolution of either 25-kilometer squared or 100-kilometer squared. Simulating a 25-kilometer dataset took 64 times more computational resources than a 100-kilometer one.
“These atmospheric model calculations would have been impossible without NERSC’s computers, scratch disk, and high performance storage system,” said Wehner. “We used several hundred million hours and about 7,000 processors on Hopper and Cori for the project.”
However, Wehner’s original atmospheric simulations did not model how the atmosphere interacts with wind waves. So Timmermans extended this work to also model and analyze global wave conditions, which represented both present and possible future wave climate. NERSC again played a critical role, supplying three million core hours that ran concurrently on 20 nodes of Edison. Using the high-resolution data and NERSC computing power, the Berkeley team was able to identify tropical storms and extreme waves that the lower-resolution data lacked.
“The abundance of resources at NERSC allowed me to push the wave model almost to its limits in terms of parallel computing capability,” Timmermans said.
Assembling Wave Climate Projections
This Berkeley Lab project is part of a new generation of global wind-wave studies completed by several international modeling groups. These individual studies, however, use various statistical approaches, dynamical wind-wave models, and data structures, making comparisons between the analyses difficult. In addition, single studies alone cannot be used to quantify total uncertainty given the range and diversity of available wind-wave modeling methods. Without a broader research effort, it remains unclear why the standalone studies sometimes differ in their projected changes in wind-wave characteristics across the world’s oceans.
The Coordinated Ocean Wave Climate Project (COWCLIP) is trying to overcome this problem by creating a consistent multivariate dataset of global wave climate projections for widespread use. Berkeley Lab is one of ten contributing institutions to COWCLIP phase 2, as described in the Scientific Data paper; all ten contributing institutions validated their global wave projection datasets with respect to observations, an important part of the production process.
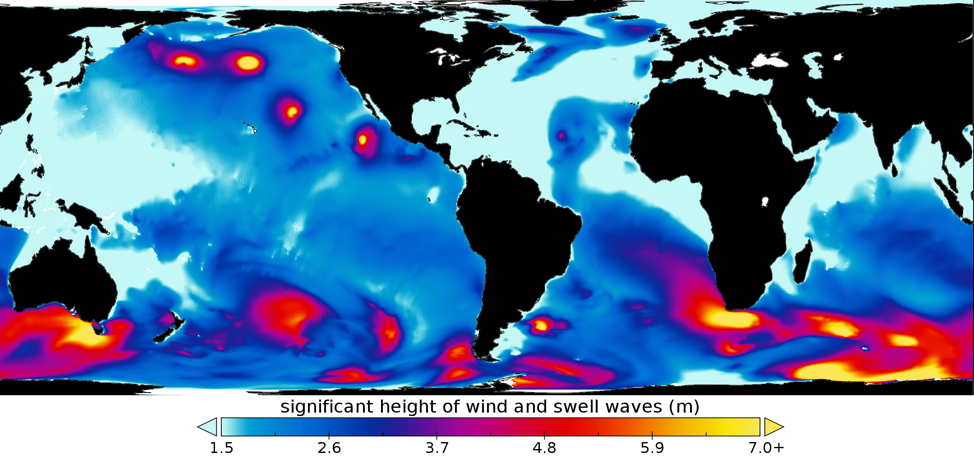
For example, Timmermans’ validation involved a comparison of his projections of wind speed and wave height distributions against observations from fixed-position oceanic data buoys maintained by the National Oceanic and Atmospheric Administration. However, the COWCLIP2 team also conducted validation on the entire ensemble of datasets, comparing against 26 years of global satellite measurements of significant wave height on a global and regional scale.
“COWCLIP is a coordinated community effort to gather and explore output from state-of-the-art simulations of ocean wave climate, identifying and quantifying the key sources of uncertainty,” Timmermans said. “This new dataset will support future broad-scale coastal hazard and vulnerability assessments and climate adaptation studies in many offshore and coastal engineering applications.”
Berkeley Lab’s high-resolution climate model output used to drive the wave model is suitable for many other types of analyses and is freely available at https://portal.nersc.gov/c20c/.
This is a reposting of my news feature, courtesy of Lawrence Berkeley National Laboratory.